The critical decision point for cover crops in Iowa row-crop systems is the spring termination window — typically late April to mid-May, before corn planting or within a week of soybean seeding. Terminate too early and you lose biomass accumulation, nitrogen fixation capacity, and erosion coverage. Terminate too late and you risk nitrogen tie-up in a high-C:N ratio residue, potential allelopathic effects, and soil moisture competition at an already challenging establishment time.
Getting that timing right requires knowing what you actually have. Pre-termination biomass assessment from aerial imaging gives you that information before you commit to a herbicide application date — and it gives it to you across the whole field, not just the three spots where you walked to pull a sample quadrat.
Why Aerial Biomass Estimation Works for Cover Crops
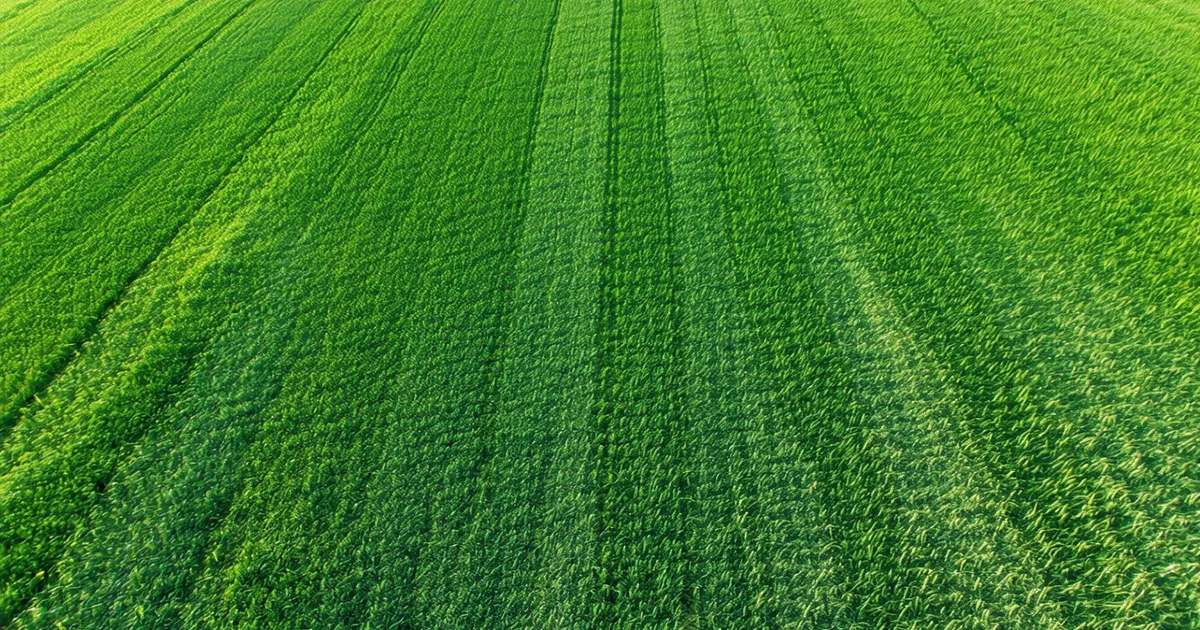
Cover crops in central Iowa overwintering conditions — cereal rye, winter wheat, hairy vetch, crimson clover, or a multi-species mix — establish canopy in fall, go dormant or semi-dormant through December-February, and begin active growth again in March. By early April, a well-established cereal rye stand might be at 8-12 inches in southern Iowa; a patchy or poorly established stand might be 4-6 inches and thin in places.
The aerial signal that tracks biomass most reliably at this stage is a combination of canopy coverage fraction — how much of the soil is covered by green plant material — and canopy reflectance in the red-edge bands that correlate with chlorophyll density and thus leaf area index. These two inputs together allow a biomass model to estimate dry matter per acre across the field.
The field is not uniform. A 400-acre corn-soybean operation in Madison County might have a cereal rye cover crop that established well in the center and south portions of a field but is thin and spotty in the north end where wet conditions delayed drill seeding and reduced germination. An aerial assessment in early April will show that spatial gradient clearly — the south 280 acres at 1.2 to 1.8 tons dry matter per acre, the north 120 acres at 0.4 to 0.7 tons. That gradient changes both the termination timing strategy and the nitrogen credit calculation for the following cash crop.
Pre-Termination Biomass and Nitrogen Credit Estimation
For legume species — hairy vetch, crimson clover, field peas — the nitrogen credit from cover crop incorporation is a real agronomic input that should factor into cash crop nitrogen planning. The standard ISU Extension approach is to sample fresh biomass, send to a lab for nitrogen concentration analysis, and apply credit factors based on estimated decomposition rates and nitrogen availability timing.
That process requires knowing how much biomass you have per acre before you can size the credit. Aerial estimation provides the biomass input; tissue sampling from representative zones provides the nitrogen concentration; and the credit calculation follows from there. Without a field-wide biomass estimate, you're applying a county-average credit to a field where the actual biomass varies threefold across the acreage.
For cereal rye and other non-legume covers, the nitrogen story is different — and here the biomass estimate matters even more. High-biomass cereal rye terminating at 3+ tons dry matter per acre can immobilize nitrogen from the soil for 4-6 weeks post-termination as the high C:N ratio residue decomposes. On corn ground, this can create a nitrogen hole at V4-V6 — exactly the same critical window where rescue nitrogen becomes necessary and expensive. Knowing that a field has a heavy rye stand in advance allows the agronomist to build nitrogen immobilization risk into the pre-plant nitrogen recommendation, rather than being surprised by V5 deficiency symptoms in a field that had high rye biomass.
We're not saying cover crops cause nitrogen problems — on balance, a well-managed cereal rye cover crop in Iowa contributes positively to soil health, erosion control, and weed suppression. We're saying that biomass at termination is an important management variable, and treating every rye-covered field as equivalent regardless of actual stand density is how growers get surprised by early-season nitrogen dynamics.
Termination Timing Decision: The Biomass Signal
The practical termination timing recommendation in Iowa for corn production is to terminate cereal rye at least 10-14 days before planting to allow soil moisture recharge and decomposition to begin. But this recommendation interacts with biomass level. A thin rye stand at 0.5 tons/acre can be terminated closer to planting without significant soil moisture competition. A dense stand at 2.5-3 tons/acre warrants a longer lead time — and may also signal a situation where burn-down herbicide efficacy needs to be assessed more carefully at the appropriate rye growth stage (pre-heading for best efficacy).
The aerial biomass estimate gives you that calibration per field. On a farm managing 10 cover-cropped fields across a planting schedule that spans two weeks, the agronomist can use the spatial biomass map to sequence termination: heaviest stands first, thinnest stands last — aligning termination lead time with actual biomass rather than using a uniform date across all fields.
Herbicide rate is also affected. Cereal rye at 12 inches in flag-leaf stage with dense canopy requires higher glyphosate rates (or combination with saflufenacil or paraquat) to achieve complete kill versus rye at 8 inches in the jointing stage. If you're walking three fields to estimate rye height and canopy, you're making one chemical order for three fields that may warrant different approaches. An acre-level height and density map lets the agronomist write field-specific termination prescriptions.
Establishment Assessment for Fall Seeding Decisions
Aerial cover crop assessment isn't only useful in spring. A fall flight at 3-4 weeks post-seeding — typically late October to November in Iowa — gives you a germination and establishment map before winter dormancy. For a field that was aerially seeded into a standing corn crop (an increasingly common practice with aerial application rates of 20-25 lb/acre for cereal rye), the germination success is highly variable depending on canopy cover at seeding time, rainfall in the two weeks post-seeding, and soil surface conditions.
An early-November establishment assessment that shows 60% canopy coverage in some areas and less than 20% in others tells you two things. First, the thin areas won't provide meaningful spring biomass or erosion protection — which is useful information for planning next fall's seeding approach. Second, if the field has been enrolled in a cover crop program with a state or federal agency that has a minimum establishment standard, the assessment gives you documentation ahead of a potential compliance conversation.
The fall assessment also helps diagnose seeding failures. If the south end of a field shows good establishment and the north end is thin, and the seeding was done by aerial application into the standing corn canopy, the aerial establishment map overlaid on the corn harvest data often reveals that canopy cover at seeding time was heavier in the north end — explaining the lower germination. That diagnostic story informs whether to adjust seeding rate, seeding date, or seeding method in the following year.
Cover Crop Data in Multi-Year Management Systems
A single year of aerial cover crop data is useful. Multiple years of aerial cover crop data — fall establishment maps and spring termination biomass maps from the same fields across several seasons — begin to reveal the underlying field variability that drives cover crop performance year over year. Zones with consistently thin or poor establishment often correlate with drainage problems, compaction layers, or soil texture transitions that independently affect cash crop performance.
Layering cover crop performance maps against cash crop yield maps and in-season stress maps is how the data evolves from an operational tool into an agronomic management foundation. The grower who's been cover-cropping for three or four years and has aerial records to go with it has a significantly richer field history to work from than one relying on memory and selected ground observations — and that history is the input to the precision management decisions that actually move yield.