What Fieldglint detects — by crop
Multispectral imaging and crop-specific AI models trained on Iowa corn belt conditions. Each crop has distinct spectral signatures for its most common problems.
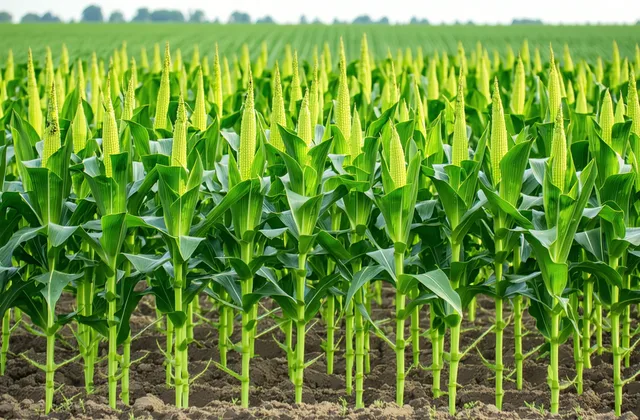
Corn
What we detect in Iowa corn
Nitrogen Deficiency
Detectable as early as V4-V5 via spectral signature. Flagged by zone and acreage. Rescue application window identified.
Pest Pressure
Canopy disruption from western corn rootworm feeding is detectable aerially. Hotspot zones flagged for targeted ground scouting.
Stand Establishment
Thin-stand rows detected at V3-V4. Possible compaction zones, planter misses, or early-season flooding events flagged by location.
Fungal Disease Pressure
Late-season gray leaf spot and northern corn leaf blight manifest as canopy discoloration patterns detectable pre-tassel.
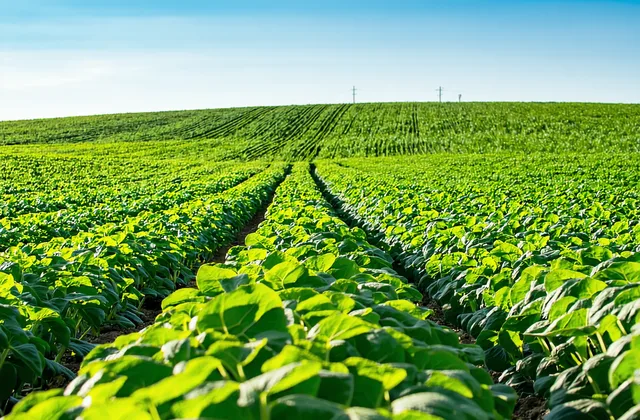
Soybeans
What we detect in Iowa soybeans
Iron Deficiency Chlorosis
IDC in high-pH soils shows as interveinal yellowing detectable from the air at V2-V4. Affected zones flagged for chelate application timing.
Sudden Death Syndrome
SDS zones show as interveinal chlorosis/necrosis patterns in mid-season. Spatial correlation with drainage patterns noted in reports.
White Mold Flagging
Dense canopy zones with white mold pressure show canopy collapse signatures at R5-R6. High-risk areas identified for scouting prioritization.
Aphid Colony Indicators
Soybean aphid hot spots create detectable canopy discoloration in large colonies. Flagged for targeted economic threshold assessment.
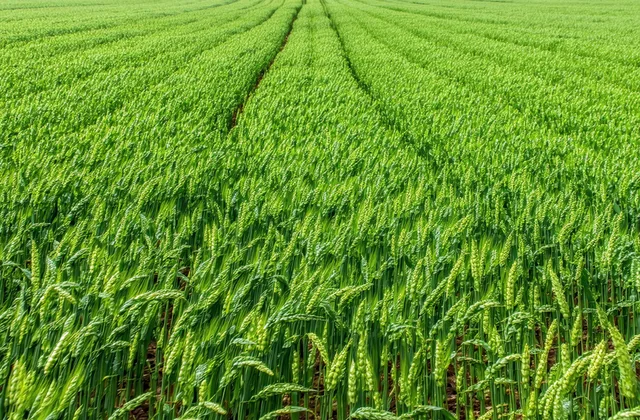
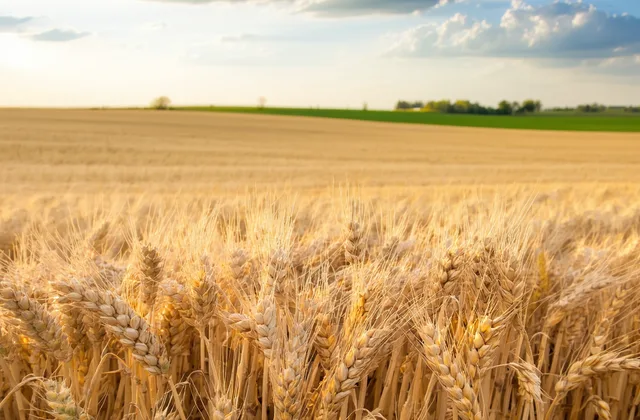
Winter Wheat
What we detect in winter wheat
Stripe Rust Zones
Puccinia striiformis infection creates yellow stripe patterns detectable aerially at flag leaf stage. Zone maps guide fungicide application decisions.
Head Scab Pressure
Fusarium head blight zones show reduced canopy density and discoloration patterns at heading. High-risk areas flagged for targeted ground inspection.
Stand Uniformity
Thin or patchy stand in winter wheat shows as low canopy density zones in early spring imagery — useful for replanting decisions.
Cover Crops
Cover crop biomass estimation
A pre-termination flight gives you a biomass estimate for cereal rye, radish, or mixed-species cover crops before the termination decision is made. The spatial variability map shows where your cover established well and where it thinned — relevant for nitrogen credit planning and herbicide rate decisions.
- Cereal rye biomass estimate (lbs/acre)
- Spatial biomass variability map — where cover established well vs. thin
- Spring nitrogen credit estimate based on biomass level
- Termination timing guidance based on crop development stage