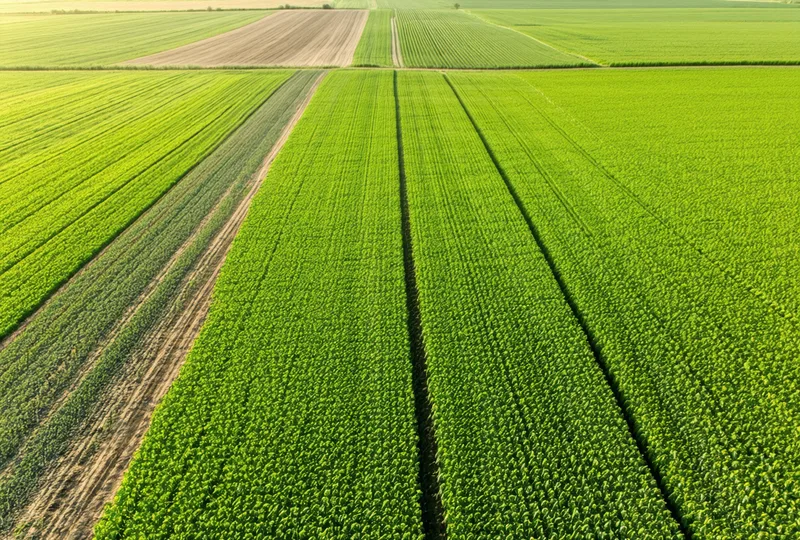
From flight to field report in 48 hours
Multispectral drone imaging, trained computer vision, and agronomic modeling turn raw flight data into prioritized, row-level scouting reports — before you walk a single acre.
Four steps from your field to your inbox
Schedule
You tell us your field boundaries, target crops, and preferred scouting window. We plan the flight routes and FAA coordination for your location in Iowa. Most growers schedule 2 flights — one pre-tassel and one post-tassel for corn, aligned to your crop's critical decision windows.
Fly
Our drone team flies your fields using multispectral sensors that capture visible and near-infrared light. This lets us see spectral signatures invisible to the human eye — the kind that indicate chlorophyll stress, pest damage, and stand irregularities a week before they're visible from the road.
Analyze
Flight data runs through our computer vision pipeline. The AI model — trained on Iowa corn belt conditions — classifies each acre-level cell by issue type and severity. Nitrogen deficiency has a distinct spectral signature. So does rootworm feeding damage. So does iron deficiency chlorosis in high-pH soil zones. Our model flags all three, separately, with confidence scores.
Receive Report
You receive a PDF report and a shareable field link within 48 hours of the flight. The report includes flagged zones by issue type, acreage estimates, severity ratings, and action recommendations aligned to your crop's current growth stage. Share it directly with your agronomist — no login required for them to view.
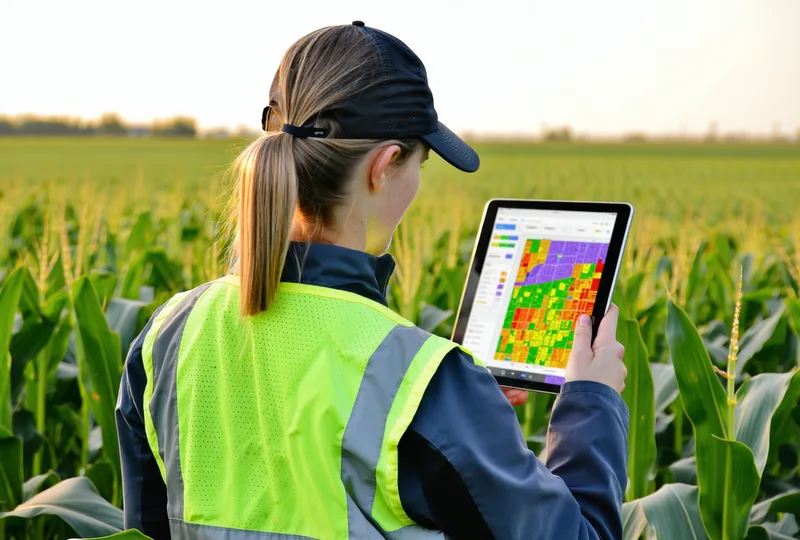
NDVI-style zone annotation — what the report shows
Three layers: imaging, classification, agronomy
Multispectral Imaging
Our drones carry sensors that capture near-infrared and red-edge bands invisible to the human eye. Stressed crops reflect differently in these wavelengths — nitrogen deficiency is detectable from the air up to 10 days before yellowing appears visually.
Computer Vision
Our model classifies spectral signatures at acre-level resolution. It was trained on Iowa corn belt conditions — high-pH soil zones, typical pest pressure patterns, and regional nitrogen timing — so it understands local context, not just generic spectral thresholds.
Agronomic Model
Detection results are interpreted through an agronomic layer — growth stage, typical decision windows, and actionable severity thresholds. A flagged zone at V5 gets a different recommendation than the same signature at R3. The report reflects the timing, not just the pixels.