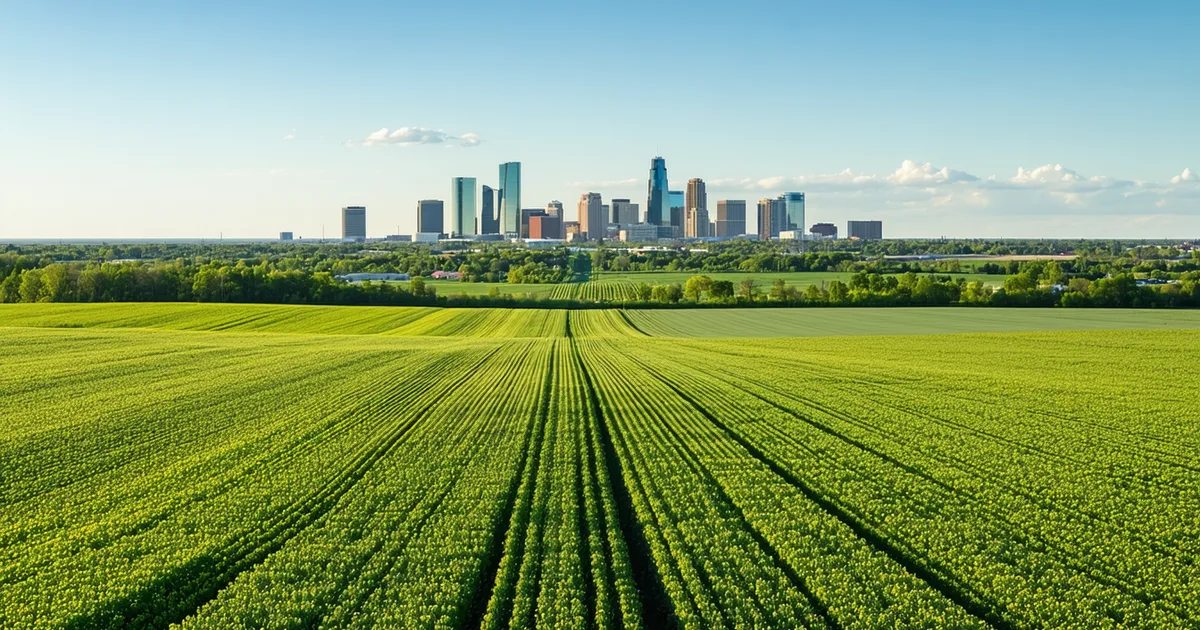
Fieldglint started in Des Moines in 2024, and that location was not an accident or a lifestyle choice. It was the right starting point for what we're building: a field scouting service grounded in the realities of row-crop agriculture in the upper Midwest, not in generic agtech ambitions applied to whatever crop is geographically convenient.
Here's the honest version of why we started here, what we found when we started talking to growers and agronomists, and what we're building into 2026.
Why Iowa, Why Now
Iowa produces on the order of 13 million corn acres annually, plus roughly 10 million soybean acres. Nearly every county in the state has active row-crop operations. The consulting agronomist in central Iowa is typically managing 20 to 40 client farms spread across one to three counties — a span of 6,000 to 15,000 total acres that all need attention during a compressed scouting window in late May and early June.
That time compression is the actual problem. During the V4-V8 corn growth stage — the window when nitrogen deficiency is detectable and correctable with a rescue sidedress application — an agronomist has roughly 3 weeks before that management door closes. Running the math on 30 farms averaging 350 acres each, fully covered with meaningful transect scouting, in 21 days: it doesn't work. Something gets skipped, walked lightly, or scheduled late enough that the intervention window is already closing when the problem gets found.
Before founding Fieldglint, we spent time embedded with agronomists in Polk, Story, and Jasper counties — following their actual field season rather than relying on how agronomy textbooks describe what a scouting workflow should look like. What we observed was that a substantial fraction of field time went to confirming that fields were clean — walking healthy acres to document no problems — rather than diagnosing and responding to the fields that actually had issues. That's not a failure of skill or effort; it's the structural reality when you're working blind, without a map that tells you which fields need your time this week.
What We Built and Why It's Structured the Way It Is
Fieldglint is a field service that uses aerial data — not a data platform that occasionally relates to fields. That distinction shapes everything about how the product is built and what it's accountable for.
A lot of precision agriculture products produce data and hand the interpretation to whoever receives the file. For some tools — yield monitors, soil sampling reports, weather stations — that's the right model. For aerial multispectral imagery, uninterpreted data produces a lot of false leads. NDRE anomalies that look like nitrogen stress but are sulfur deficiency. Compaction rings that look spectrally similar to disease. Waterlogging zones around tile outlets that produce nutrient-stress signatures for a reason that has nothing to do with soil nitrogen levels. The interpretation layer is where the data becomes actionable, and it requires agronomic knowledge that the raw image doesn't contain.
Our reports flag zones with a suggested diagnosis — not just "anomaly detected" but a specific classification (nitrogen stress, pest pressure, stand establishment issue, or other stress type) paired with the reasoning behind it, calibrated to the crop stage, the time of year, and the field's location within Iowa's soil complexes. An agronomist getting that report knows not just where to walk but what to look for when they get there.
The 48-hour turnaround from flight to report is not a marketing claim — it's the operational requirement that the V4-V8 window dictates. A 5-day turnaround is analytically accurate but practically useless if the nitrogen correction window is 4 days wide by the time the report arrives.
What We Got Wrong in Year One
The first version of our reports was too detailed. We were delivering full NDRE gradient maps, raw band composite images, and multi-spectral index outputs — material that remote sensing specialists find genuinely useful and that most working agronomists find overwhelming when they're already managing a full client load. The feedback from agronomists in our first operating season was consistent: the report required interpretation work they didn't have bandwidth for.
That feedback drove a significant redesign. The current report leads with a single-page zone summary: acreage flagged by issue type, GPS coordinates, and plain-language field location descriptions ("northwest quadrant, 45 acres, nitrogen stress probability high — recommend ground verification near the field's tile outlet drain"). Spectral detail is an appendix for those who want it. The redesign was the right call, and we should have started there.
We also underestimated the grower education component. A grower receiving an aerial scouting report for the first time, seeing that two of their fields show nitrogen stress flags, and not having a clear picture of what action that warrants — that's an onboarding gap we had to address after the fact. Building the "here's how to use what we're telling you" conversation into the product from the start would have saved us awkward follow-up calls in the first season.
Iowa as the Right Training Ground
The soil variability across central Iowa — particularly the Clarion-Nicollet-Webster association that covers the Des Moines Lobe — creates enough within-field heterogeneity to stress-test the spatial precision of any field detection system. A 480-acre field in Hamilton County can have three distinctly different soil drainage classes within it. Flagging a 25-acre Webster soil zone running nitrogen-short within that mosaic is a harder problem than flagging a whole-field nitrogen deficiency, and it's the problem that has real management value.
Starting in Iowa also gave us access to the full problem suite for the crops we support. Iron deficiency chlorosis in soybeans on calcareous soils. Western corn rootworm in continuous corn acres. Sudden death syndrome in soybean fields with compaction issues. Cover crop biomass variation across fields with mixed establishment success. All four crops are actively grown across Iowa, and all the detection challenges we'd face in a broader geography are present here in concentrated form.
We're not saying Iowa is the hardest or most complex agricultural geography — it isn't. We're saying it's a good model for the corn-soybean system that makes up the core of the upper Midwest, and depth in Iowa translates reasonably well to southern Minnesota, northern Missouri, and eastern Nebraska — the natural geographic expansion for 2026.
What 2026 Looks Like From Here
Two product priorities dominate heading into the 2026 season. First, multi-year zone records: growers who have been flying with us since 2024 or 2025 now have enough aerial history to start seeing patterns. Chronic stress zones that appear in the same field location across multiple seasons, even in years with different weather profiles, are the most valuable signals in precision agriculture — they point to underlying soil or drainage conditions that drive management change. Building those longitudinal views into the dashboard is the highest-value product work available to us right now.
Second, the Agronomist Pro workflow. Agronomists managing 25 or more client farms need tools that go beyond a report per field — they need a morning briefing that prioritizes which fields to visit this week, in what order, with GPS coordinates ready to navigate directly to flagged zones. That's what we're building toward: a workflow where Tuesday morning's flight set produces Tuesday afternoon's field visit list, sorted by urgency and geographic routing efficiency, before the agronomist has left their truck.
Des Moines will stay the operational center. The corn belt is where we started and it's not close to being fully mapped.