Western corn rootworm (Diabrotica virgifera virgifera) is the most economically significant corn pest in the Midwest. Adults emerge in mid- to late July, feed on silk, and lay eggs that hatch into larvae the following spring — larvae that feed on and prune corn roots, causing lodging, "goose-necking," and yield drag. In continuous corn acres across Iowa, the economic threshold for adult beetle pressure is well-established: roughly one beetle per plant during the silking window.
The question we get asked regularly is: can you see rootworm pressure from the air before you'd catch it walking? The honest answer is: it depends on what you're looking for and when.
What Aerial Imaging Can Detect — and When
Rootworm larval feeding damage doesn't create a clean spectral signature early. Underground root pruning happens before any above-ground visual cue appears. A plant with two or three nodes of roots removed by larval feeding may look perfectly normal in a mid-June multispectral scan. The aerial signal emerges later, and it comes from canopy disruption, not from the feeding itself.
The detectable signatures fall into two categories:
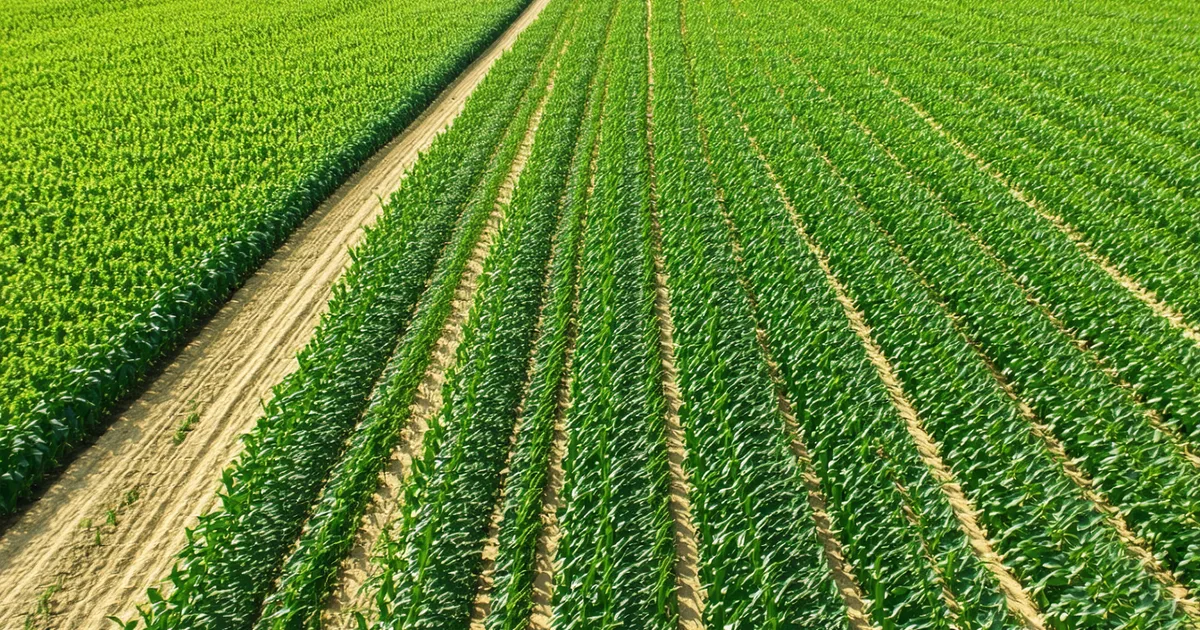
Lodging patterns: Severe root pruning leads to plants that tilt or "goose-neck" — the characteristic angled stems of rootworm-damaged corn. From 200-400 feet altitude, a block of lodged corn is clearly distinct from standing crop. The canopy geometry changes, row spacing disrupts, and reflectance patterns shift because the plant orientation relative to the sun is no longer uniform. This is reliably detectable via aerial imaging — but it occurs after significant damage has already happened, often R1-R3 stage in July.
Canopy stress ahead of economic threshold: Moderate root pruning (roughly 1-1.5 nodes pruned, below visible lodging) creates a mild water and nutrient stress signal as the root system's ability to take up water is compromised during pollination — arguably the highest-demand period for the plant. During a dry July in Iowa, plants with reduced root mass will show measurable NDVI/NDRE depression ahead of full lodging. This is the earlier signal, but it requires dry conditions to be distinct, and it's subtle enough that it overlaps with drought stress signals from non-rootworm-damaged plants.
The Threshold Problem: You're Flying After the Fact
Here's the piece we're direct about with every grower: aerial detection of rootworm damage is post-economic-threshold detection in most cases. By the time canopy disruption is visible or measurable from the air, economic damage has already occurred. What the aerial map tells you is where the infestation was heaviest — valuable for planning next season's soil insecticide or trait decision, but not a same-season rescue tool the way nitrogen detection can be.
We're not saying aerial rootworm detection has no value. We're saying its value is primarily decision-support for the following year's management: which fields had hot spots, which quarters of a section are repeatedly problematic, whether the infestation is spreading from a consistent entry point (often a field border adjacent to a previous-year corn field). That data drives better trait selection, soil insecticide placement, and rotation decisions — all of which are made in the fall or winter for the following crop.
For in-season management, adult beetle trapping with sticky traps or vial traps during July remains the standard method for confirming economic threshold and timing silk protection. Aerial imaging complements that workflow by mapping the spatial extent of damage — not by replacing the threshold-based decision.
Spatial Pattern Analysis: Where Aerial Adds Genuine Value
One thing aerial imaging does better than any ground-based scouting protocol is reveal the spatial structure of an infestation. Rootworm pressure in Iowa frequently follows predictable landscape patterns: it's heavier in continuous corn fields, heavier in fields with a history of Bt trait resistance populations (a growing concern in parts of Iowa, Indiana, and Illinois), heavier in areas with heavy residue that supports overwinter egg survival.
Take a 640-acre continuous corn section in Hardin County. Ground scouting with transect lines will confirm the presence of beetles and estimate density at sample points, but it won't produce an acreage map of where the pressure was concentrated. An aerial image captured at R1-R2 — during peak adult emergence and silk feeding — combined with a lodging assessment map at R3-R4 gives you a polygon of the 80 acres where pressure exceeded threshold, the 200 acres with moderate sub-threshold feeding, and the remaining 360 acres that were essentially clean. That spatial map is what allows a precision soil insecticide prescription for the following spring — applying in-furrow insecticide only to the hot-zone acres rather than full-field treatment.
For a 640-acre field, the difference between a blanket soil insecticide application and a targeted one to 80 hot-spot acres is significant at $15-20 per treated acre. The aerial map that drives that prescription has a clear return on investment independent of whether it changes any in-season decision.
Resistance Considerations and Detection Limitations
The emergence of western corn rootworm populations with reduced susceptibility to Bt traits (Cry3Bb1 and mCry3A pyramids have both been documented with field-evolved resistance in Iowa) creates a complication for aerial damage interpretation. A field planted with a Bt rootworm trait should theoretically show less root pruning and less lodging — but in a field with a resistant population, the expected trait protection isn't present, and the aerial damage pattern looks like a continuous corn non-Bt situation even though the grower paid the trait premium.
When an aerial scan shows significant rootworm lodging in a Bt trait field, that's a flag worth investigating in detail — not because the aerial image tells you resistance is present, but because the pattern is unexpected and warrants soil sampling and root-rating the following spring to confirm what happened. University of Illinois and Iowa State extension have published root-rating protocols for assessing larval feeding severity post-hoc; aerial damage mapping at R3-R4 is the pre-screen that tells you which fields to root-rate.
Adult Beetle Flight and the Trap Integration Question
Some agronomists use a combination of adult sticky-trap networks and aerial imaging during July to build a more complete pressure picture. The traps tell you timing and density; the aerial map tells you spatial distribution in the canopy. Neither alone is complete.
The practical challenge with adult aerial detection is that peak adult emergence in Iowa runs mid-July through early August — a period when corn is at R1-R2 and canopy cover is at maximum. At high canopy coverage, flight path overlap and image stitching artifacts can reduce per-row detection reliability compared to the V4-V8 window when canopy is thinner. This is a real limitation: aerial imaging works best for plant-level stress detection when the canopy isn't yet fully closed, but rootworm adult emergence peaks exactly when it is.
The workaround is to focus aerial analysis on lodging and canopy geometry rather than reflectance-based stress indices during this period. Lodging detection based on plant angle and row disruption is actually more robust at high canopy than NDRE-based chlorophyll estimation, because the geometric signal doesn't depend on per-leaf reflectance clarity.
Planning for Next Season: The Practical Takeaway
If rootworm is a recurring concern on your continuous corn acres, the most useful aerial deliverable isn't a June scouting report — it's a late-July to early-August lodging and canopy disruption map that you can overlay on your fall yield map. Where lodging and yield drag co-occur in the same zones year after year, that's your evidence base for a targeted management change: rotation, trait pyramid, soil insecticide, or some combination.
The fields where aerial rootworm mapping most clearly pays off are those over 400 acres in continuous corn with a history of variable pressure — where ground scouting has told you "it's bad in spots" but hasn't given you the acreage map needed to write a field-specific prescription. Translating "bad in spots" to "these 90 acres on the northeast end consistently exceed threshold and warrant targeted treatment" is the gap that spatial aerial data fills.